

 Opinion Leaders
The folly of forecasting
-
Ian Lance
Funds Manager
Redwheel
Exaggerated expectations, excessive optimism and when profits do not grow in line with turnover: predictions are difficult – especially about the future.
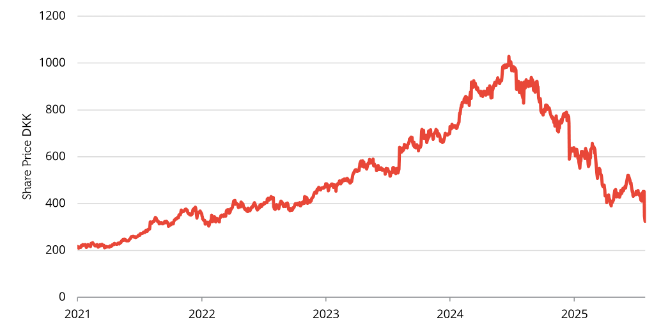
Two recent events have inspired me to write (yet again) about the folly of forecasting when it comes to investment. The first was when the Danish healthcare company Novo Nordisk lowered their profit forecast for 2025, and the share price lost a fifth of its value in one day; as the chart below shows, the shares have now lost two thirds of their value in just over a year. This was less a story of the company suddenly losing money than it was of investors simply making assumptions that were overly optimistic: at DK1000, investors in June 2024 paid 52x the 2023 EPS of DK18.67, a price which implies a conviction that Novo’s diet drug, Ozempic, would very likely generate strong future profits growth. Only twelve months later, the growth rates that such investors predicted failed to materialise, resulting in substantial losses. In our view, there are two lessons to take from this. Firstly, forecasting – even twelve months out – can be very hard. Note there will be Biochemistry PHDs at investment banks and hedge funds, armed with more industry data than you could possibly imagine, who got this one wrong. The second lesson is that when expectations are very high – reflected in a very high share price relative to historical earnings – even a slight disappointment can create a dramatic impact on valuations. In this case, expectations for the company’s full-year sales growth in 2025 were lowered to between 8% to 14% – down from an earlier target of 13% to 21% – and profit growth forecasts were lowered to between 10% to 16%, down from previous estimates of 16% to 24%. So even though profit growth is still likely to be very healthy, it has disappointed very lofty expectations, which explains the savage share price reaction.
Novo Nordisk Share Price
The second recent inspiration on the subject was when I was flicking through Charts to Make You Go Wow! 2025 by Jim Reid of Deutsche Bank. Given the current euphoria around the Magnificent Seven stocks – which seems to be driven by a belief that all of them are going to invest billions in AI, and that all of them are going to be winners – I was intrigued by a chart that added some interesting historical context to those assumptions. The chart showed that only two of the ten largest companies in 2000 have outperformed the S&P500 since that date, those two being Microsoft and Oracle; incredibly, four of these companies actually made lower nominal earnings in 2024 than they did in 2000 (Citigroup, IBM, GE and Intel being the members of this unfortunate club). In 2000, these ten stocks were the largest in the market, and also highly valued, partly because investors were confident in their future growth rate. I suspect that if you had surveyed investors at the time, and asked for a probability that (nearly half?) four of these much-loved companies would have lower earnings twenty-four years later, most people would have put the probability at zero. Certainly, the valuations of those companies at the time reflected the market handicapping this probability as a completely outside-chance event.
Robust to a range of outcomes
Having now been investing for over thirty-five years, one of the most important lessons I have learnt is that the future is inherently unpredictable, and that it is therefore both a waste of time trying to forecast the unforecastable, and also potentially detrimental to investment returns. This may seem strange to readers, since most in our industry spend their time confidently making predictions about the future. I rarely hear a fund manager on Radio 4’s Today programme say “I really don’t know” in reply to a question on their outlook or admit that their recent outperformance may simply be down to (a) luck or (b) the waxing and waning of investment styles. I have seen interest rates at +15% and -1%, the oil price at $10 and $150, and the FTSE 100 at 6400 and 3500 in the same twelve-month period. Many things that I felt sure would happen have not come to pass, and there have been things that have occurred that I never would have predicted in a million years (central bankers printing money to buy equities, or fund managers buying negatively yielding bonds, being two very prominent examples). Once you accept that it is difficult to make accurate predictions, especially about the future, you will be more inclined to build an investment strategy that is robust to a range of outcomes, rather than one that is dependent on one forecast scenario playing out. This is one of the key reasons why we believe value investing delivers greater long run returns than growth investing: the value investor is buying stocks where expectations are low, which increases the chances of a ‘surprise’ being a positive one. By contrast, growth investors are buying stocks with heady expectations built into their prices, and – as the Novo Nordisk example demonstrates – when expectations disappoint, even when the absolute outcomes are impressive, the reaction can be savage.
Value vs. Growth
Investing is always going to involve some sort of forecasting, but my own approach to forecasting changed in 2003 when someone I worked with gave me a paper called Intuitive Prediction: Biases and Corrective Procedures by Daniel Kahneman and Amos Tversky (long before the Thinking Fast and Slowand The Undoing Project became best sellers). This taught me that the accuracy of predictions can be improved by pulling them towards the class average, and hence using base rate rather than singular data:
One of the basic principles of statistical prediction, which is also one of the least intuitive, is that the extremeness of predictions must be moderated by considerations of predictability. ….prediction should be regressive; that is, it should fall between the class average and the value that best represents one’s impression of the case at hand.
Evidence suggests that people are insufficiently sensitive to distributional (base rate) data even when such data are available. Indeed, recent research suggests that people rely primarily on singular information, even when it is scanty and unreliable and give insufficient weight to distributional information.
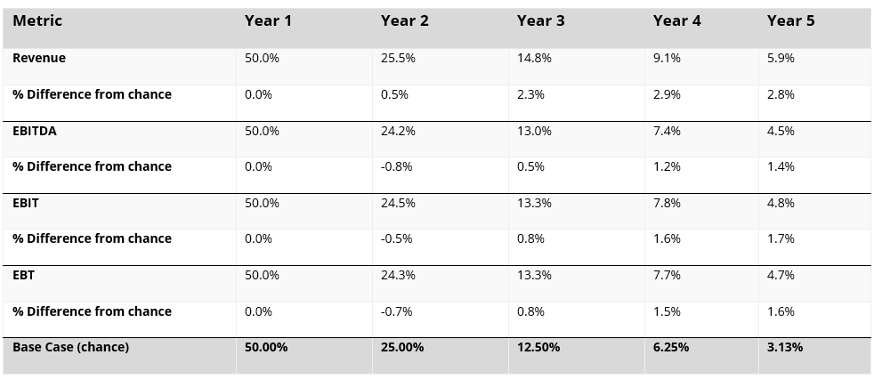
Applying this to our two examples above, healthcare analysts could have used the base rate data shown in the table below when thinking about their Novo Nordisk forecast. This shows how the number of companies able to sustain above average growth rates falls very rapidly each year, making a prediction that Novo Nordisk would buck this trend a low probability outcome. As the stock sported a very high valuation, making above average growth rates essential for investors not to lose money, this made an investment in Novo a potentially risky one.
Persistence of Growth Rates (1997-2021)
Turning to the Magnificent Seven stocks, one could use singular data and try to predict the exact profits that these companies are going to generate from AI over the next decade (which strikes me as difficult, given the potential for unknowns such as the arrival of challengers like Deepseek), or one could focus on base rate data. For example, one such piece of base rate information is the fact that the ten largest stocks in the S&P500 under perform on average (see chart below). Another fact is that very highly valued stocks also tend to underperform; as the Magnificent Seven stocks are both top ten constituents of the S&P500, and highly valued, probability would suggest that they are likely to underperform the S&P500 in the medium to long term. We cannot say with certainty that this will happen, but investment success comes from trying to tilt the odds of success in your favour; historical evidence simply suggests that the ten largest stocks in the S&P500 are unlikely to beat the wider index over time, especially when starting from such high valuations.
Top 10 Largest Stocks in the S&P 500 vs S&P 500

Overconfidence in the ability to forecast seems to be endemic to our industry, and I suspect it is a function of the type of people the industry attracts (you don’t tend to meet that many shy and retiring fund managers who lack confidence in their own ability). And this is, in fact, good news, because value investing is in part the exploitation of over-optimism and overconfidence in the average investor. As investors who favour base rates over singular data points this means the following is true of how we approach making predictions:
- We will not try to forecast the unforecastable, nor produce thousand-line models.
- We will look at long run historical averages and ask whether there is any reason to believe the future will be materially different from the past.
- We will use peer group data – to what extent is this company similar or different to its peers? Is there any reason it should/should not make industry average returns? – to give us a normalised frame of reference.
- We will invest in businesses where low valuations reflect expectations for low or no future profit growth, thus increasing our probability of being rewarded by an outcome that is better than that implied by the share price


