 Opinion Leaders
VSTOXX Interest Jumps amid Record Low European Volatility
-
Dr. Jan-Carl Plagge, Head of Applied Research
With European equity volatility at historical lows, more investors may be seeking protection against an increase in price swings.
Amid a surge in investor optimism, volatility in European equities has sunk. The EURO STOXX 50® Volatility Index, or VSTOXX®, last month touched historical lows. Meanwhile, trading in derivatives on the benchmark for volatility in Eurozone stocks has reached an all-time high.
Investors have bid European stocks higher this year amid expectations that a global economic expansion is gathering pace, and as concern about populist victories at elections from the Netherlands to France eases. The EURO STOXX 50® Index of Eurozone equities has risen 6% since January1, remaining shy of a record high.
The VSTOXX indices track real-time options prices for the EURO STOXX 50, thus reflecting market expectations of future volatility – also known as implied volatility – in Eurozone stocks. As markets fall or rise, prices for options tend to move in opposite direction. This responds to investors and traders buying or selling protection against increasing future moves, prompting changes in implied volatility.
Figure 1 shows the performance of the VSTOXX Index (based on options maturing in 30 days) and the Euro STOXX 50 Index.
Figure 1
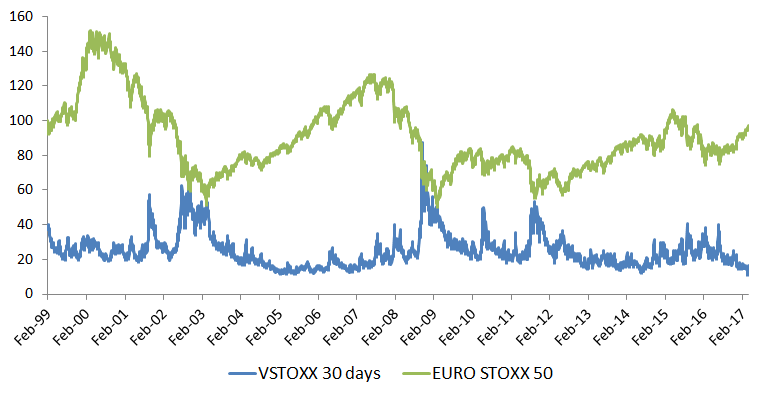
Source: STOXX
Implied volatility picks up markedly in down markets and smoothens down in bullish environments, creating an efficient hedge against market downturns. The overall correlation between the VSTOXX and the EURO STOXX 50 since 1999 is -0.74.
Accessing the volatility market
The drop in volatility levels has coincided, more broadly, with increased investor interest in recent years in volatility as an asset class. With the VSTOXX, investors have opened up to the benefits of trading a liquid and one-stop volatility product that’s representative of the whole equity market, as opposed to single-stock options or a basket of options.
A monthly average of 2.4 million VSTOXX futures and options contracts exchanged hands in February and March, according to data from Eurex, as investors seek hedges in a market that’s extraordinarily calm. That implies an increase of 154% from a year earlier. In February, 119,838 contracts were traded daily, also a level never seen since the products were introduced in 2009. Activity held up in March.
“Investors are getting increasingly familiar with the VSTOXX as a means both to hedge their equity portfolios in times of uncertainty and to bet on an increase in volatility in tranquil times,” says Giulio Castelli, head of product development at STOXX.
A tactical and strategic tool
Castelli highlights some key uses for the VSTOXX:
– Directional trading: volatility is viewed as an asset class per se, virtually uncorrelated with markets, where people can express views on future direction. “Away from ‘hot’ times, implied volatility fluctuates in well-defined ranges around its moving average,” says Castelli. “Implied volatility indices display a clear mean-reverting nature.”
– Dispersion trading: a bet on divergence or convergence in volatility between an index and its components.
– Volatility spread trading: bet on difference in the volatility of two indices.
– Hedging tool: volatility investments are used as an overlay against a naturally short-volatility portfolio (such as a traditional long equity portfolio). A short position in volatility can help hedge a long-volatility portfolio such as a long position in convertible securities. A long position in volatility can also offset increased tracking error in a portfolio during more volatile markets.
– VSTOXX as allocation trigger: a VSTOXX target level can be used to drive a dynamic allocation between the EURO STOXX 50 and cash. Past performance shows that the cushioning of drawdowns largely offsets the returns given up by targeting a fixed level of volatility.
VSTOXX methodology
A two-step process leads to the determination of the level of a VSTOXX index:
In the first step, EURO STOXX 50 options traded on Eurex are grouped by maturity. For each of the first eight standard maturities available, a portfolio is constructed that determines the implied volatility of the EURO STOXX 50 for that maturity: this will be referred to as a VSTOXX sub-index of a certain tenor.
In the second step, a target tenor for volatility is identified: for instance, a constant 30-day volatility. To achieve this constant time to maturity, the average of two sub-indices is calculated. The two elected sub-indices will have the closest (variable) time to maturity to the targeted, fixed term and be weighted in such a way that the resulting combined time to maturity matches the targeted one. The resulting average is called a VSTOXX main index and represents the implied volatility of EURO STOXX 50 over the targeted term.
Although the main index VSTOXX 30 days is the most popular one – and is usually referred to as the VSTOXX – eleven other main indices are calculated, covering fixed maturities up to 360 days in increments of 30 days.
For more on the VSTOXX methodology, please click here.
Implied vs. realized
Implied volatility expresses the market’s view on future volatility. This contrasts with historical – or realized – volatility, which measures the standard deviation of past returns over a certain period and, just as implied volatility, is usually expressed in annualized terms.
For instance, a security with a volatility of 32% has moved – on average, and assuming 256 days in a year – by plus or minus 2% every day around its mean daily return.
Although knowing how a security behaved in the past may tell something about its future performance, it can’t predict the impact of events – known or unknown – that are going to happen.
Financial options give their owner the right to buy or sell a security at a future date at a predefined price. The fair value of an option can be thought of, in a risk-neutral world, as the present expected value of the option at maturity. Estimating the future realization of the security’s price means making hypotheses about its development between now and the option’s maturity: in other words, it means estimating the realization of future volatility.
Realized volatility is typically lower than implied volatility, as Figure 2 shows. A few reasons can explain this behavior. Buying implied volatility can be seen as purchasing insurance. Given that realized volatility increases in turmoil, people are willing to pay a premium (represented by the higher level of implied volatility relative to its future realization) in order to be compensated in the event of deteriorating markets.
Figure 2
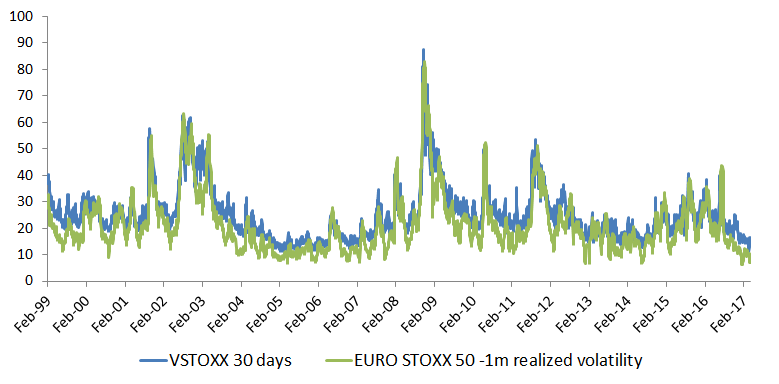
Source: STOXX
Additionally, given its ‘anti-cyclical’ nature, there are fewer natural sellers of implied volatility than buyers.
A global theme
Lower price gyrations are not unique to Europe. The realized volatility for the STOXX® Global 1800 Index (based upon 1-year weekly returns) reached 8.48% in March, its lowest since at least 2005. Given these low levels, discussions and strategies around volatility are likely to abound in coming months.
1 Net returns in euros.